Experience the power of visually modifying Excel based models interactively in PowerPoint, without involving teams of analysts.
It's really that simple.
Play Video
What is Activegraf, and Why
ActiveGraf redefines speed in analytics, turning complex data models into user-friendly, what-if scenarios 10 times faster. Escape the trap of missed opportunities due to slow data analysis and propel your decisions from hindsight to foresight with unparalleled agility.
“Turing every what-if into the heartbeat of possibility.”
Experience ActiveGraf, offering solutions beyond the limitations of other software.
Drag & Decide
Just click and drag charts to drive unlimited scenarios for fast, informed, collaborative decisions. It’s the quickest route from “what if” to “wow”.
Turning every what-if into the heartbeat of possibility.
GrafData
Effortlessly make live, bidirectional connections between multiple data sources, calculations, and your graphs.
ActiveGraf transforms your models to what-if applications with click-and-drag ease!
GrafSync
Tech so advanced, when you adjust one ActiveGraf, all ActiveGrafs reflect the impact simultaneously.
Given them immediate answers to infinite scenarios with ActiveGraf
Play Video
Experience the power of visually modifying Excel based models interactively in PowerPoint, without involving teams of analysts.
It's really that simple.
What can ActiveGraf do that other tools can't?
ActiveGraf works
as hard as you do
Unleash the power of conversation and inquisitiveness to steer the visual narrative of your dashboards and presentations. Break free from the confines of static pages and ignite dynamic, interactive data storytelling.
Accelerate decisions: It democratizes analytics and reduces expenses.
Flexible, effortless: Every calculation from the most simple to the most complex becomes effortles to adjust, and even more valueable.
Reverse the process of scenario analysis with visual modeling
Interactively adjust your charts with simple drags to alter assumptions and instantly visualize the consequences.
Excel synchronization is seamless, obviating post-meeting model or presentation updates – cutting iteration time by 70%.
Get insights faster
through visual modeling and control
Craft powerful, predictive, and prescriptive dashboards directly within PowerPoint.
Fuel valuable insights through engaging dialog and dynamic, interactive charts.
Turning every what-if into the heartbeat of possibility!
Seeking effortless chart formatting?
Delight in point-and-click simplicity paired with intuitive, icon-driven design tools for a streamlined creation experience.
ActiveGraf is
more than a Visualization tool
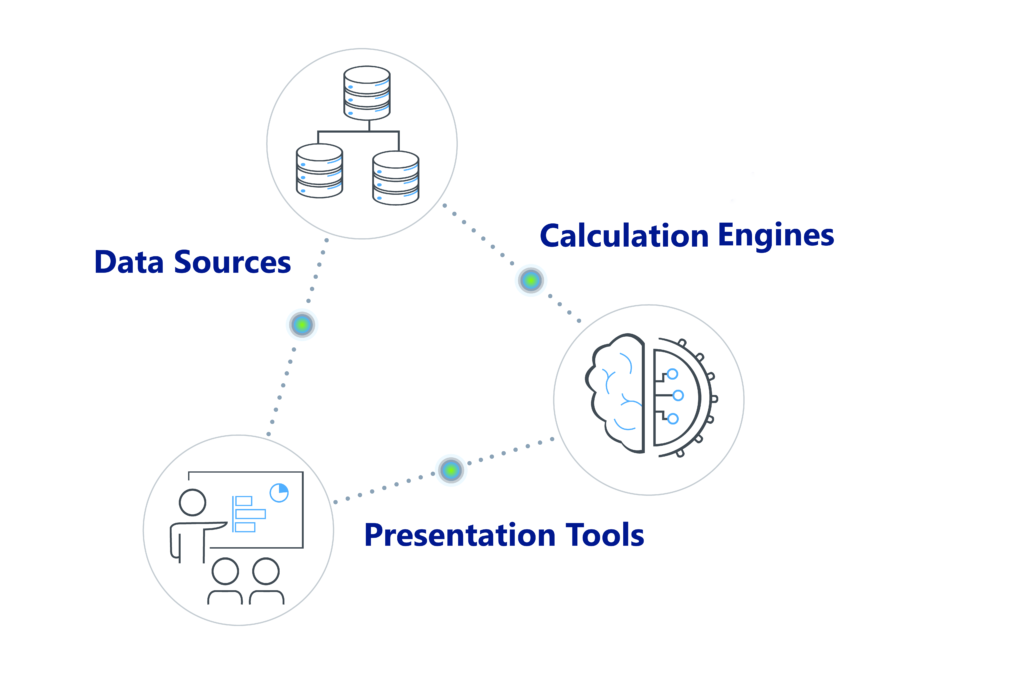
It’s a patent pending bi-directional data hub. Once connected, bi-directional synchronization of multiple data sources, calculation engines, and visualizations are possible in real-time.
ActiveGraf is
more than a Visualization tool
It’s a patent pending bi-directional data hub. Once connected, bi-directional synchronization of multiple data sources, calculation engines, and visualizations are possible in real-time.
The tech behind the tech
PowerPoint
Excel
Python
Copyright 2021 ActiveGraf Inc. All rights reserved.